The Thunder’s offense seems to be firing on all cylinders — as it stands today (3.3.2024), the Thunder are the 4th highest scoring team (121.2 points per game) and maintain the 3rd highest offensive rating (119.4 — only the Celtics & Pacers are higher). From an eye-test perspective, the Thunder’s offense can be mostly generalized as two-fold:
- Force turnovers and get out in transition — the Thunder lead the league in opponent turnovers forced (at 15.6 turnovers a game). They also lead the league in points scored off turnovers per game (at nearly 20 points a game).
- In half-court setting, it’s either Shai Gilgeous-Alexander pick & rolls and / or isolation plays. He’ll often drive (Shai is leading all players in drives for the 4th year in a row) and if the defense doesn’t bring a second or even a third defender, Shai will often get to the rim (leading all guards in points in the paint at 15.2 points in the paint per game, on average) and / or pull-up a midrange jumper (of all guards who shoot >3 mid-range shots per game, Shai is shooting 3rd highest % at 48.6%). If the defense over commits, he will often move the ball to a spot-up shooter, which the Thunder is leading the league in 3 Point shooting at 39.6%.
The playtype tracking stats will also prove the eye-test. For the 2023 – 2024 season, the Oklahoma City Thunder offense can be characterized by the following composition provided by NBA.com stats (from highest frequency of playtypes run per game to lowest):
| Spot Up | Transition | P&R Ball Handler | Isolation | Other | |
| Description | Ball is passed to a player who immediately shoots the ball | Offense doesn’t have a set play and often immediately follows after a defensive stop — all five defenders are often not back in time. | A second player will set a screen for the ball handler and the ball handler will either drive to the basket; dribble & pull-up at mid-range and / or 3 point | Ball handler will have space created so that the ball handler can often beat his / her matchup 1:1. | Cuts, handoffs, post-ups, shooting off-screens, etc. |
| Frequency | 25.9% | 20.7% | 17.4% | 8.3% | 27.7% |
NBA.com playtype & tracking stats only contain data from the past 8 years. I was curious to see from an offensive architecture standpoint, what former NBA championship team the Oklahoma City Thunder play similarly to.
As shown on the below radar chart, 2023 – 2024 Oklahoma City Thunder’s offense is very similar to 2018 – 2019 Toronto Raptors’ offense in their regular season — look at how similar the structure of the web is:
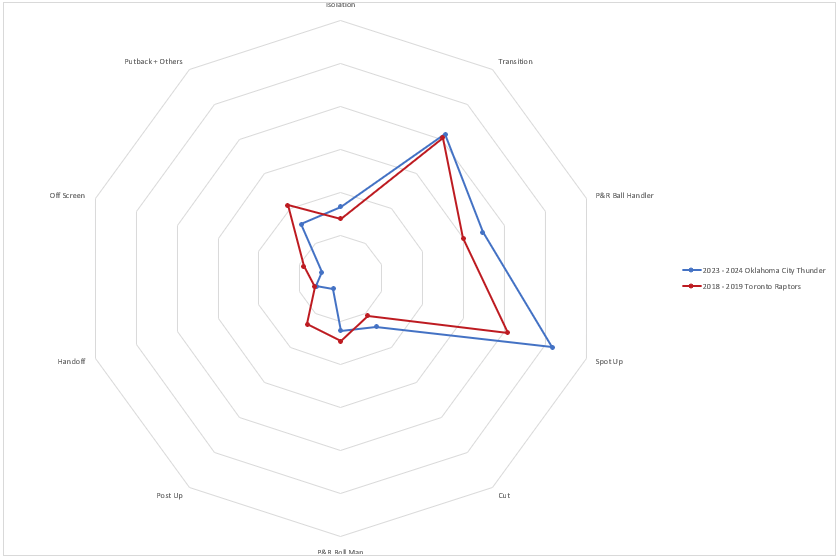
Both teams’ top 4 play types are very similar and have same highest to lowest frequency order (directionality is the same). The transition frequency is about the same between the two teams. From a directionality perspective, both teams had similar P&R ball handler and spot-up frequencies as well. I would argue that the real major difference is that Toronto had slightly higher plays revolving off-screen actions & post-ups.
It’s neat to see how the Thunder’s offense looks eerily similar to 2018 – 2019 Toronto Raptor’s, but how does the efficiency compare for this season’s Thunder vs the prior championship teams?
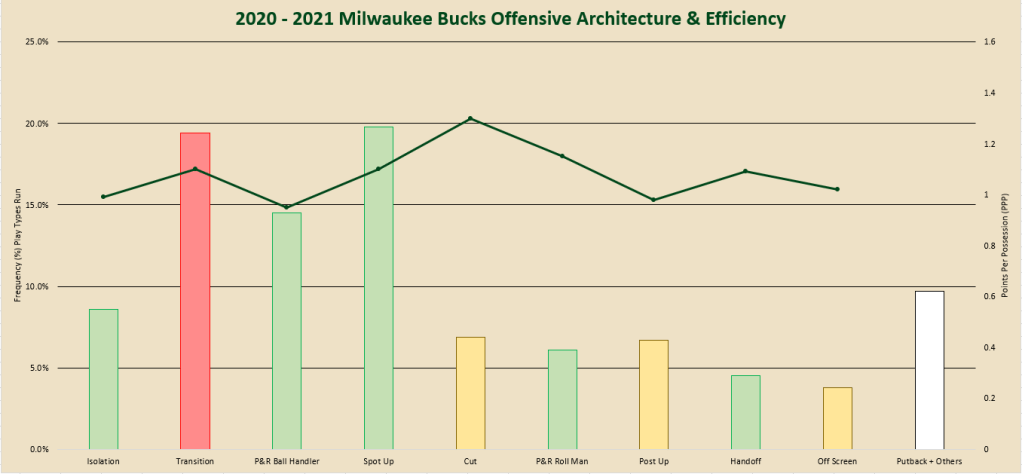
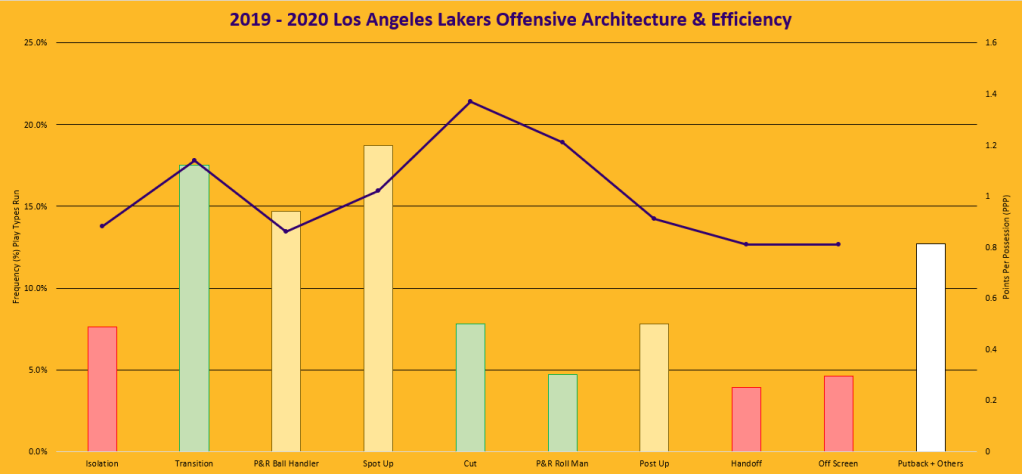
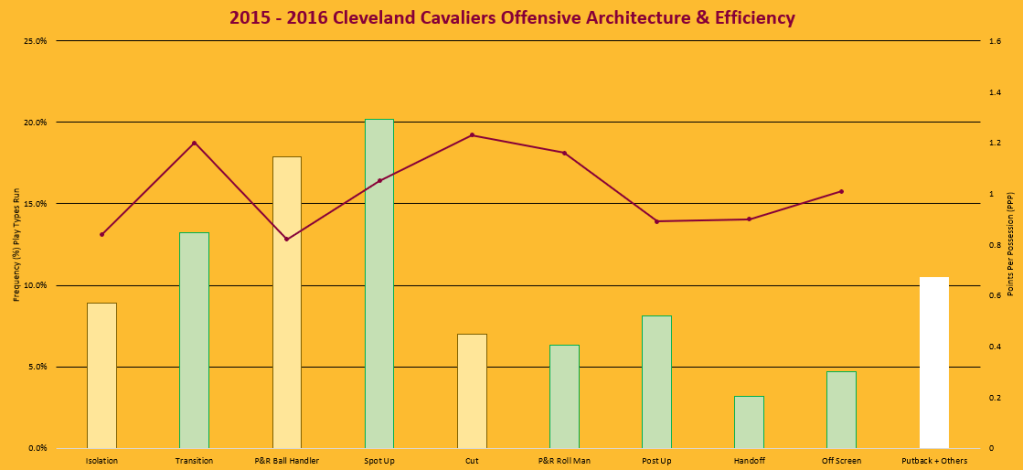
To answer this, I looked at develop bar-line combination graphs. The bar chart will show the frequency (%) of play types run for that team in their respective regular season. The line chart, plotted in the secondary axis, will show points per possession indicating how efficient that team was in running those plays. Finally, the bars will also be color-coded to indicate relative rank of efficiency compared to the rest of their respective league for that season. The reason relative rank matters is because it’s well noted that offensive efficiency has been increasing every year. Thus, it’s not an apples-to-apples comparison to benchmark points per possession for 2015 – 2016 Cleveland Cavaliers with this season’s Oklahoma City Thunder. The color codes are as such:
- Bar with light-green fill: The team ranks 1st – 10th in the league for that playtype in points per possession, regular season
- Bar with light-yellow fill: The team ranks 11th – 20th in the league for that playtype in points per possession, regular season
- Bar with light-red fill: The team ranks 21st – 30th in the league for that playtype in points per possession, regular season
- Bar with white fill: did not quantify the relative ranks
So for the 2023 – 2024 Oklahoma City Thunder, they rank relatively highly as they are top 10 across all play types but two (these figures are taken as of 2.26.2024 and doesn’t reflect shifts from @SAS and @PHX games):
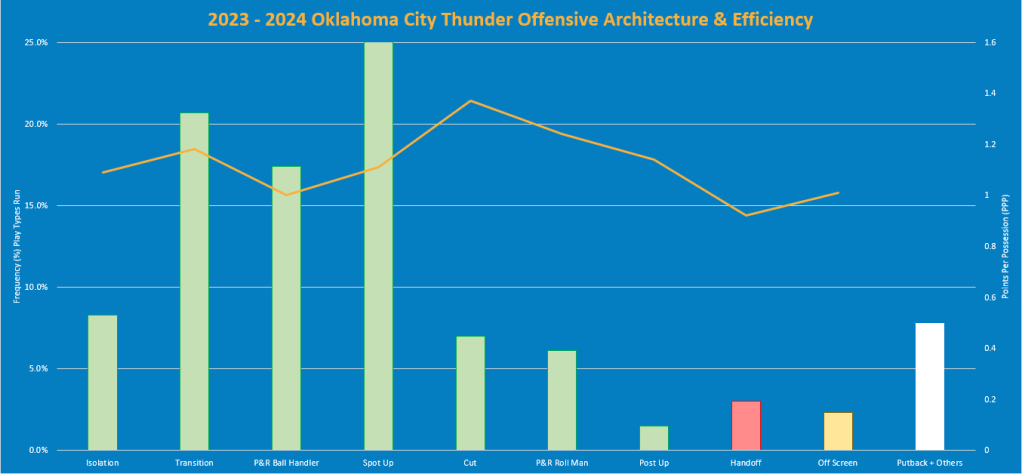
The encouraging takeaway here: the areas where the Oklahoma City Thunder are either middle third or bottom third in are areas where the Thunder do not run on high frequencies (both handoffs and off-screen actions are run for a combined ~5%).
Shown below are the prior 8 championship teams:
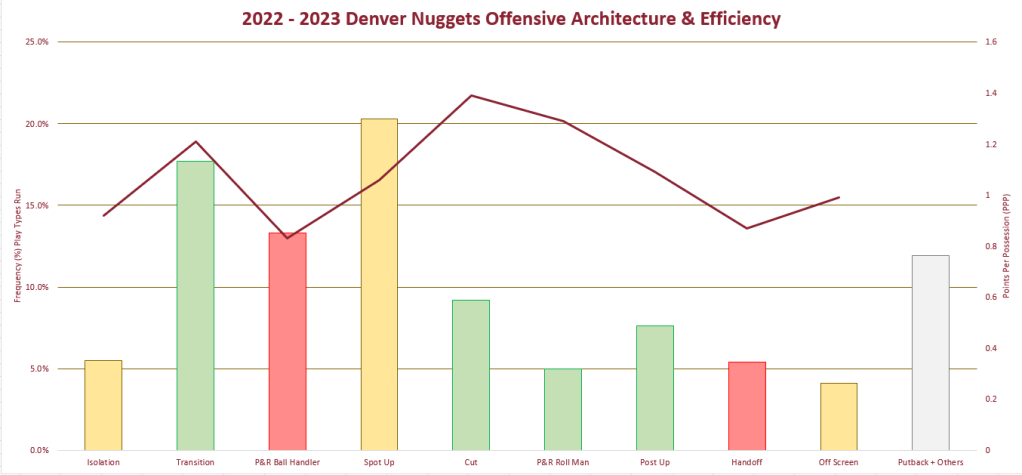
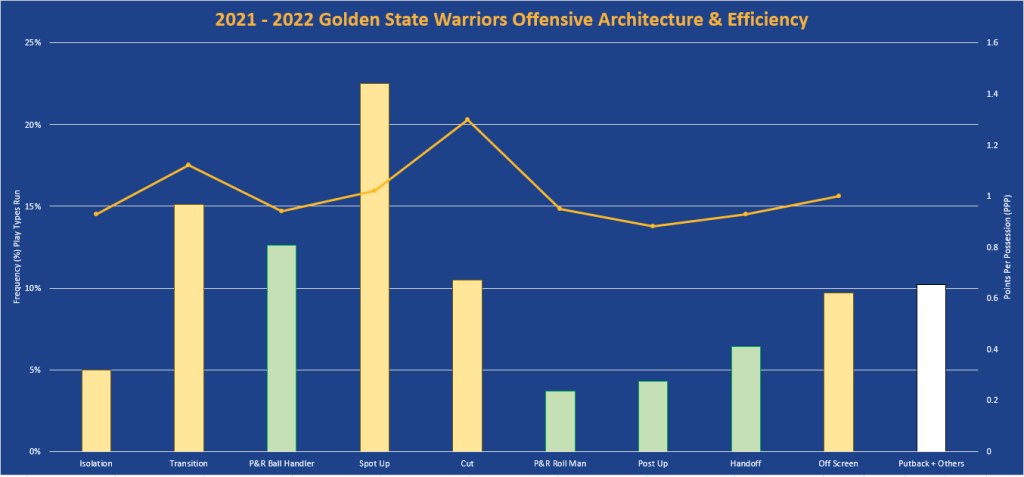

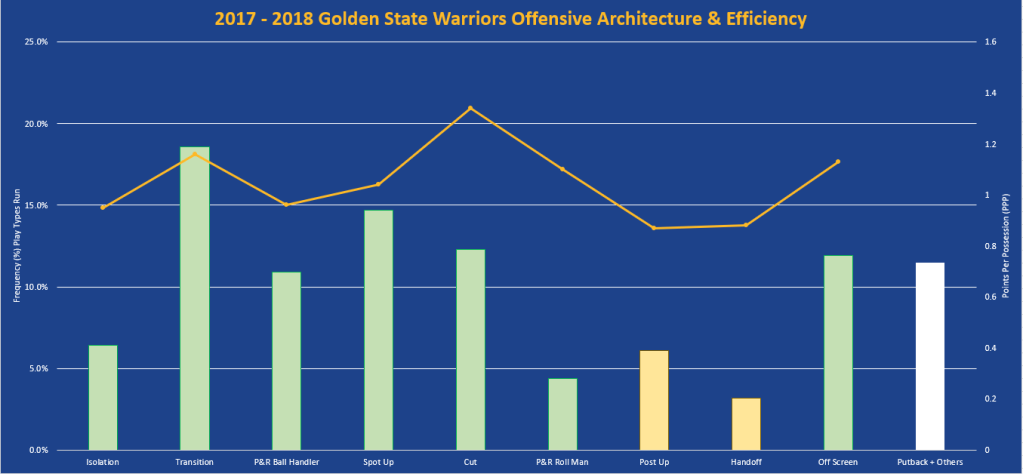
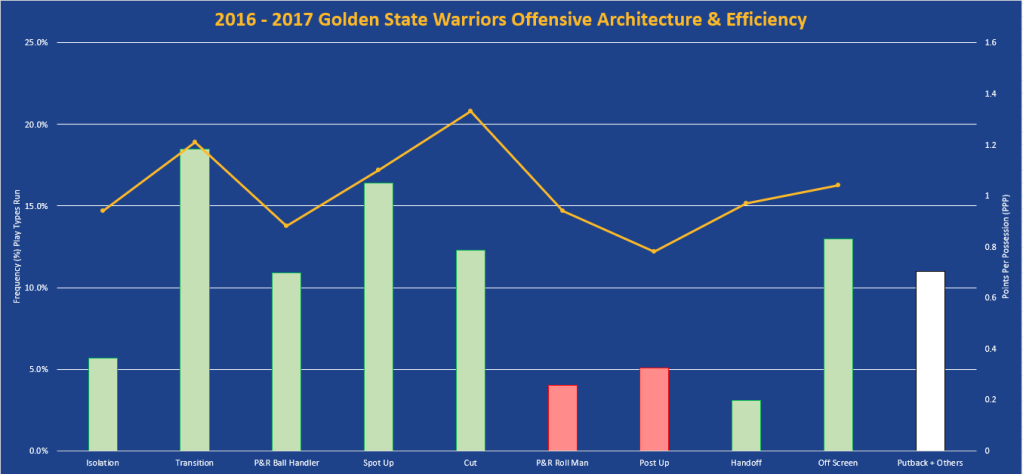
One interesting takeaway: as mentioned, Oklahoma City Thunder has green bars across all categories, except two. Only 2 teams that are prior champions (in the past 8 years) have the same amount of green bars — the 2016-2017 Golden State Warriors and the 2017-2018 Golden State Warrior. To think that this team is relatively performing as well as a core of Steph Curry, Klay Thompson, Kevin Durant, and Draymond Green is shocking to think about.
Am I saying that this year’s Oklahoma City Thunder’s will be a dynasty like the Golden State Warriors? No, it’s too soon to draw that conclusion — remember this is showing just offensive architecture during the regular season. Playoff offensive efficiency may be far different (and not to mention that the defensive side must also be elite).
However, I did have some curiosity around whether teams shift their offensive architecture during the playoffs from a frequency of plays run perspective. For the most part, there aren’t any seismic shifts (which makes sense — teams had the entire regular season to prepare themselves for different looks). However, there was an interesting trend: all prior 8 NBA champions would increase the frequency (%) of isolation plays run in the playoffs vs the regular season — this makes sense… teams want to put the ball in their stars hand during crunch time and hope that they can beat their man 1:1. Specifically, on average there was a 260 basis point increase of isolation plays run in the playoffs vs the regular season e.g., if a team runs isolation plays 10% of the time in the regular season, then in playoffs that team would run 12.6%. This may not seem like a major jump but all other categories were about flat in their changes from regular season to playoffs. Obviously this incremental addition should come from somewhere: there’s a 150 basis point decrease, on average, of off-screen plays run during playoffs for these championship teams.
What is the purpose of bringing this point up:
Conveniently, the Thunder rank first in the league this year in isolation points per possession at ~1.09 points per possession. That’s driven by two guys:
- Shai Gilgeous-Alexander ranks 2nd in isolation points per possession by generating ~1.18 points per possession.
- Jalen Williams ranks 13th in isolation points per possession by generating ~1.05 points per possession. (once again, this data was pulled around 2.26.2024)
The question becomes: can Shai and J-Dub maintain their high efficiency on isolation plays? That’s where there’s a ton of skepticism around the media pundits: there’s lack of playoff experience.
I took a deep-dive into Shai & J-Dub by first looking at their performances in the play-in last year (2022 – 2023 season):
- Shai Gilgeous-Alexander: against the Pelicans & Timberwolves, Shai’s points per possession on isolation plays dipped significantly to 0.83 points per possession on 42% eFG. For the 2022-2023 regular season, Shai was 10th in the league in isolation points per possession (1.06 — wild to see that jump to 1.18 this season) on 48% eFG.
- Jalen Williams: against the Pelicans & Timberwolves, J-Dub’s points per possession on isolation plays dipped even more significantly to 0.33 points per possession (could argue sample size here or lack thereof. For the 2022-2023 regular season, J-Dub was generating 1.07 points per possession (however on a considerably negligible sample size e.g., 6.9% frequency on isolation plays for J-Dub vs 23.5% frequency on isolation plays for Shai).
There’s obviously a learning curve that we need to account for. So, I looked into Shai and Jalen Williams’ isolation splits for this regular season in close games (I defined close games as games where the point differential was + or – 10 points heading into the fourth quarter). My objective in doing this was trying to forecast whether these two’s isolation games would pan out in clutch, more pressure-packed situations analogous to playoff games. The results were somewhat intriguing:
- Shai Gilgeous-Alexander: in my defined close games, Shai has had a total of 54 possessions this regular season where he had isolation plays. He has generated on average 1.17 points per possession on those plays. This is very similar to his 1.18 points per possession that he has for the entire season so far.
- Jalen Williams: in my defined close games, J-Dub has had a total of 25 possessions this regular season where he had isolation plays. Here, we see a dip where he’s averaging 0.96 points per possession in those situations (recall that his regular season average is 1.05).
My prediction is that Shai will take a step-up in isolation situations for the playoffs. The high volume of isolation plays he had in last year’s play-in and the fourth quarter clutch stats indicate to me that he will probably be ready for the moment — I’m curious to see how Jalen Williams will respond and truly believe his fourth quarter performance will be our X-factor in the playoffs. The irony, in all of this, is that Jalen Williams has been the King of the Fourth this season — however, most of that comes from him being a pick & roll ball handler. Either way, the hope is that this year’s playoff serves as a launching pad for these two moving into next season.
So, to recap (since this article is admittedly a bit all over the page this time):
- This season’s Oklahoma City Thunder offense is similarly constructed to that of 2018 – 2019 Toronto Raptors when comparing to the prior 8 years of NBA champions
- From an efficiency standpoint, the Oklahoma City Thunder are on-par with the 2016-2018 Golden State Warriors. Both teams, in their respective seasons, share the same amount of play categories where they were top 10 in the league.
- In the playoffs, all prior NBA champions increased the amount of isolation plays run with almost all other things being equal. This gives additional confidence to the Oklahoma City Thunder given their high isolation efficiency, spearheaded by both Shai and Jalen Williams. Shai is showcasing that his high isolation efficiency may translate into the playoffs, whereas, J-Dub might slightly regress.
As always, thanks so much for taking the time to read some of my RumbleRants!

Leave a comment